The Household Pulse Survey is a nationally representative survey designed to rapidly capture the effects of COVID-19 on factors such as housing, employment, health, and education of people across the United States.
By Genevieve Smith and Angela R. Watson, Updated May 2025
General Overview
The Household Pulse Survey, conducted by the United States Census Bureau, is an online survey that intends to measure the impact of emergent social and economic matters on U.S. households since the onset of the COVID-19 pandemic. A link to complete the survey is administered via email or text to randomly selected households across the country.
Data from the Household Pulse Survey (documented by our team in May 2025) shows that the percentage of school-aged children reported as homeschooled during the 2023-2024 school year was 5.92%. This compares to 9.92% of students in private schools, and 84.16% in public schools. These numbers are largely similar to those estimated for the previous school year, with a slight increase in homeschool enrollment (+0.1 percentage points) and a slight decrease in private school enrollment (-0.1 percentage points).

5.92% School-Aged Children in the United States
Considering data from the 2023-2024 school year, homeschooled students represent about 5.92% of all school-aged students in the U.S. Please see the "National Findings" section for more information on these estimates.
“"Pulse gives us a real-time snapshot of homeschool participation across the country and by state. This is valuable information, especially for states where we have little other data."
Survey Phases
Since April 2020, the Household Pulse Survey has undergone four phases. The distinction between these phases is important because the collection periods and survey questions are subject to change. For example, the first phase was collected and disseminated weekly, but all subsequent phases have had two-week collection and dissemination periods.
During Phases 1.0 through 3.0, the survey asked participants about whether children in their households were enrolled in “public/private” or “homeschool.” However, this question may have been confusing because it did not clarify homeschool as “NOT enrolled in public or private school” until Phase 3.1. U.S. Census Bureau researchers note that respondents may have marked homeschool thinking that it was the same as virtual learning, which is why they later changed the wording to better clarify this distinction.
Enrollment by School Type
In week 61 of the Household Pulse Survey, the question regarding the school type enrollment of school-aged children in participating households was updated to reflect student enrollment during the 2023-2024 school year. This question specifically stated, “During the school year that began in the Summer / Fall of 2023, how many children in this household were enrolled in Kindergarten through 12th grade or grade equivalent?” The response options that participants were given were as follows: “number enrolled in a public school,” “number enrolled in a private school,” “number homeschooled, that is not enrolled in public or private school,” and “none.” The participants also had the option to not answer this question, which was marked as “did not report” in the data file.
National Findings
We were able to make approximate national and statewide estimates on the share of students that homeschooled during the 2023-2024 school year compared to other schooling options. During these weeks, the percentages of school-aged children in households that were reported as homeschooled ranged from 5.20% to 6.91% at the national level. When taking the average of all these weeks together, the share of school-aged children reported as homeschooled was 5.92%. This compares to 9.92% of students in private schools, and 84.16% in public schools.

During the previous school year, 2022-2023, we found the national share of homeschooled students to be 5.82% compared to 10.06% of students in private schools and 84.12% in public schools.
It is important to note that these percentages reflect the responses of household members that chose to participate in the survey, and not actual state enrollment numbers.
In addition, after consulting with researchers from the U.S. Census Bureau, we decided to remove respondents that chose “none” or that did not respond to the question. We did this because we were specifically interested in comparing enrollment percentages among public, private, and homeschooled students. While the “none” category may have included students in alternative education paths, it also likely included households with children below Kindergarten age, or respondents that did have students enrolled in school but that misunderstood the question. Exclusion of the “did not report” responses helps to ensure more accurate calculations.
State Data
According to the Household Pulse Survey, the states with the highest shares of reported homeschooled students during the 2023-2024 school year were Alaska (16.15%), Tennessee (10.75%), and Montana (9.03%). The states with the lowest shares were Connecticut (3.01%), Washington, D.C. (3.04%), and Massachusetts (3.39%).
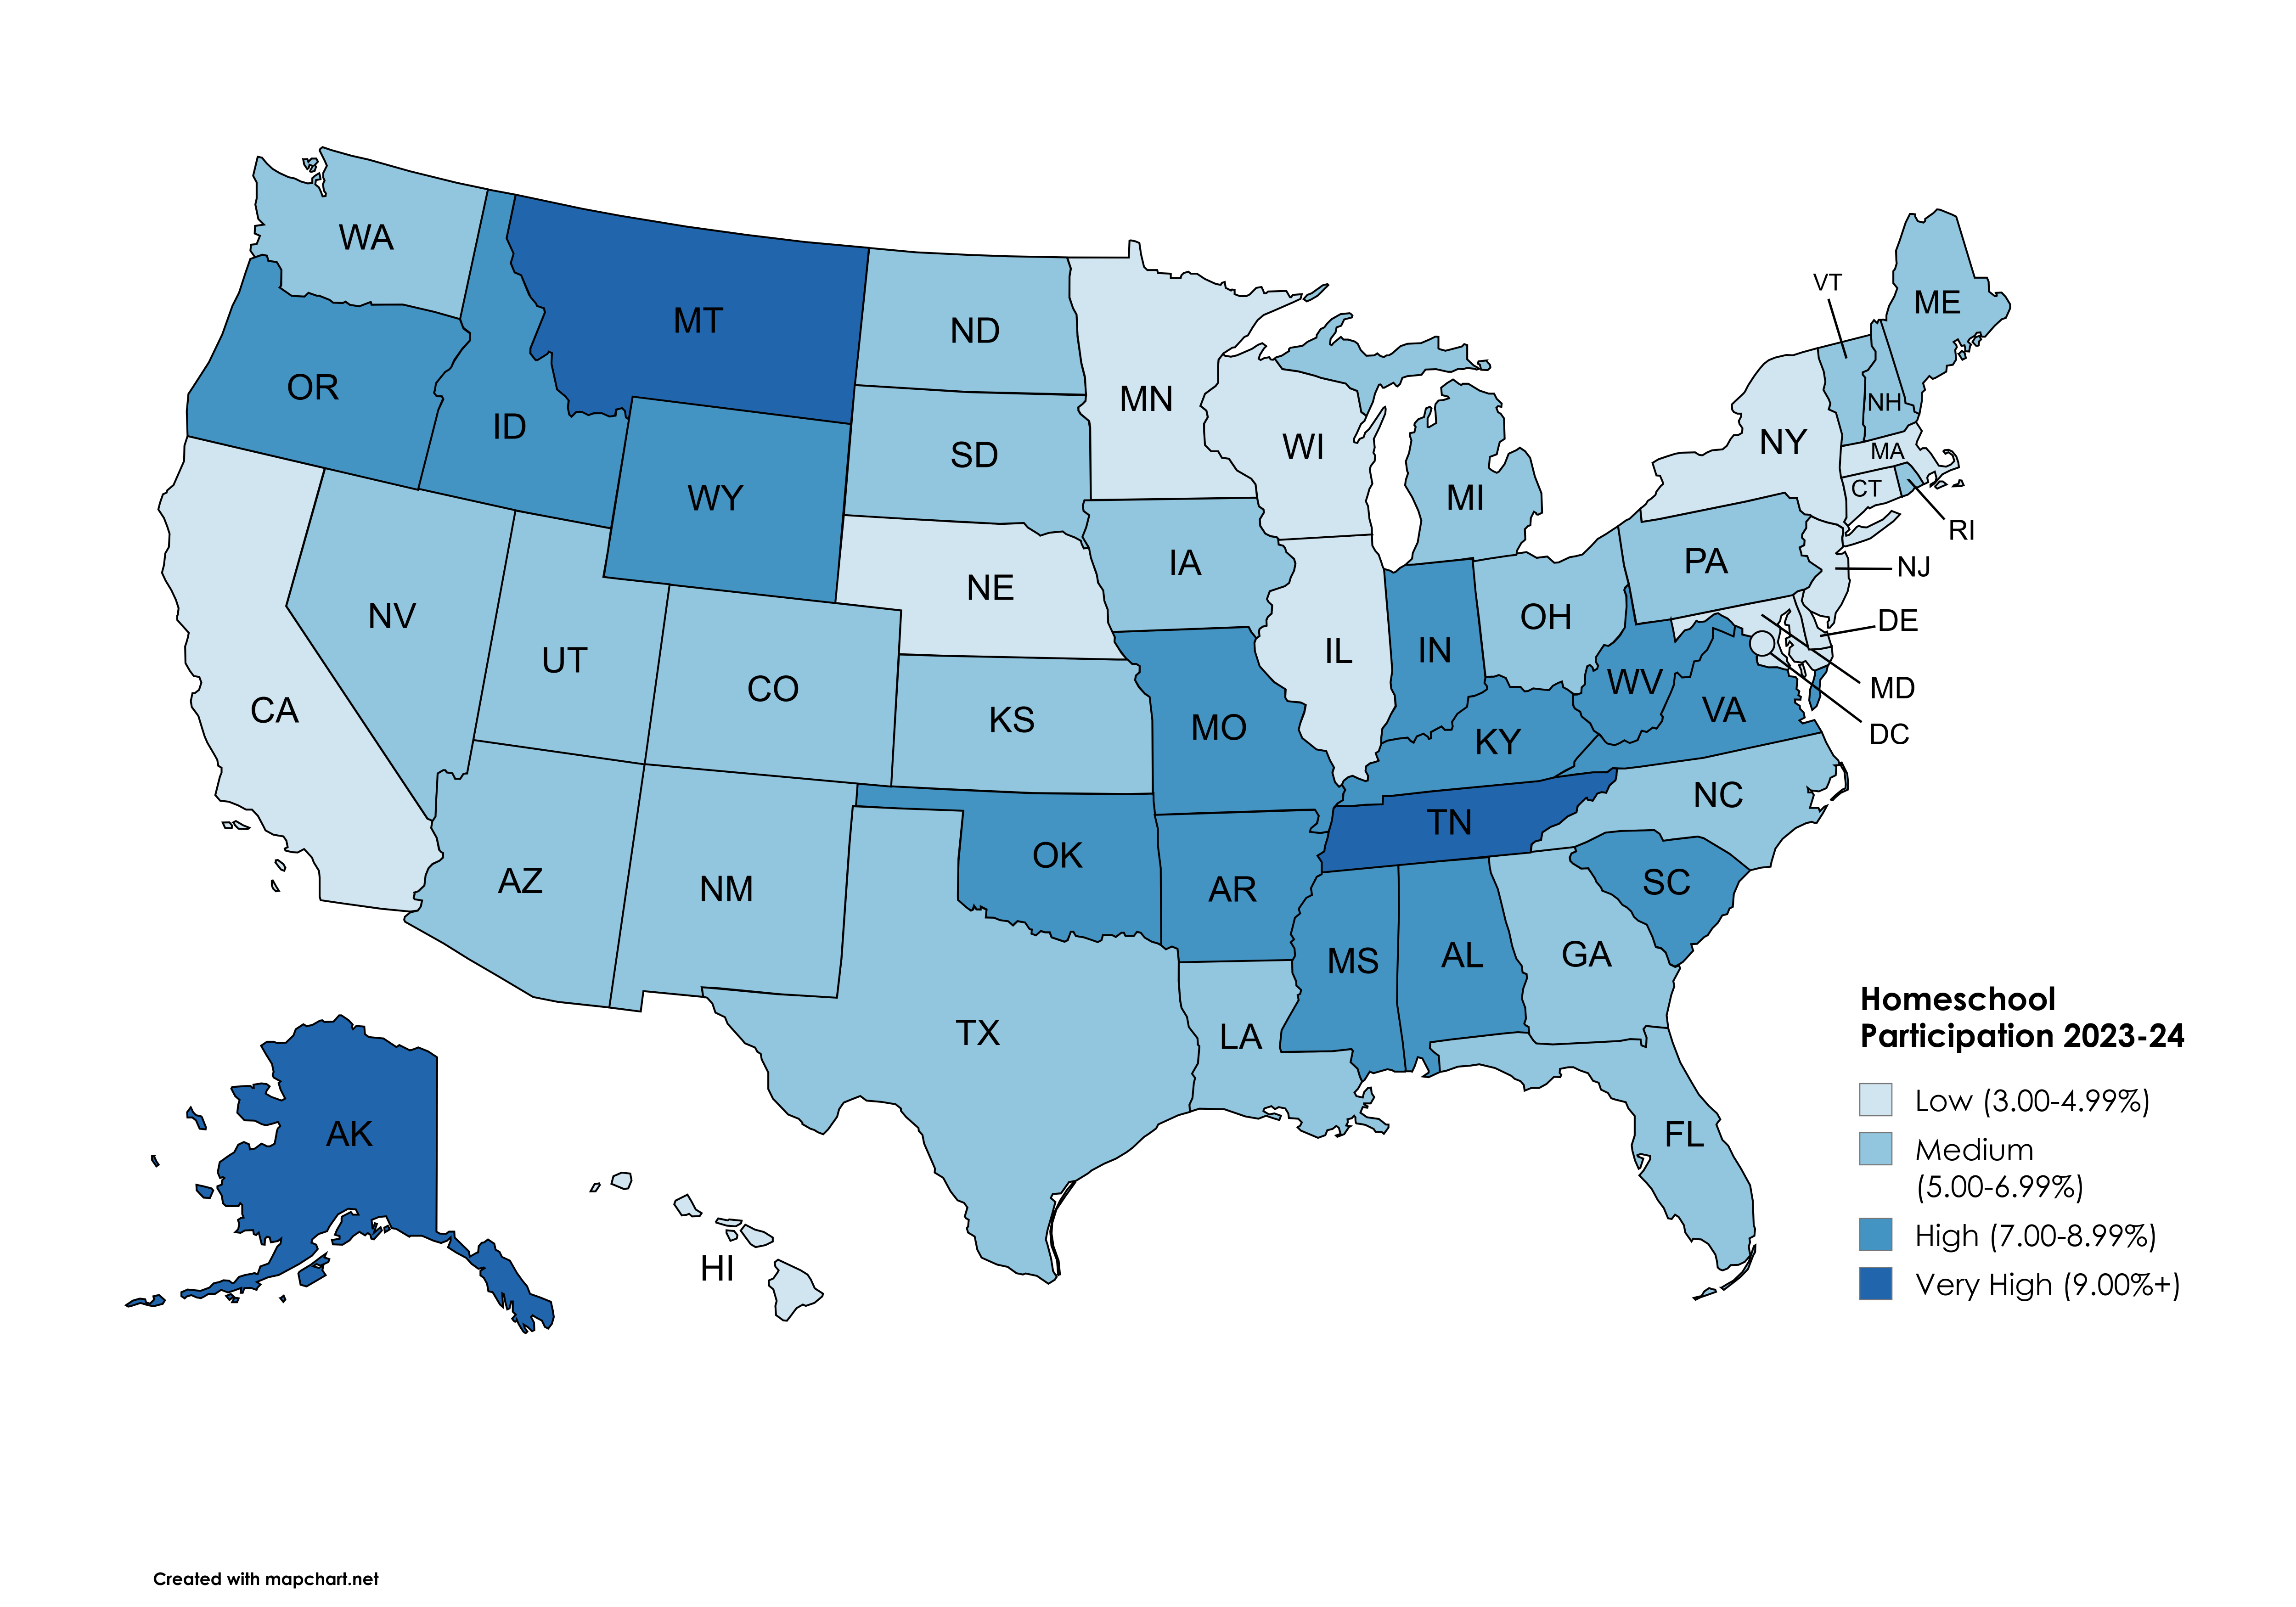
The states that saw the largest increases in reported homeschool enrollment over the previous school year were Alaska (by 3.6 percentage points), Rhode Island (by 2.5 percentage points), and Tennessee (by 1.7 percentage points). Those with the largest decreases were Washington, D.C. (by 5.5 percentage points), Hawaii (by 1.7 percentage points), and Maryland (by 1.3 percentage points).
For comparison purposes, the states with the highest homeschool shares during the 2022-2023 school year were Alaska (12.56%), Tennessee (9.02%), and West Virginia (8.89%). The states with the lowest shares were Rhode Island (2.86%), Massachusetts (3.14%), and New York (3.23%).
Participant Demographics
The Household Pulse Survey not only helps us understand participation of homeschooled students, but also provides demographic information about the survey participants. Considering data from the 2023-2024 school year, we can gain a more comprehensive understanding of the demographics of households with students that homeschool.
Here we look specifically at participant characteristics of age, race and ethnicity, gender and sexuality, education level, and household income. This information is particularly important because the vast majority of states do not ask homeschooling families to report demographic information, and thus, very little is known about these characteristics of homeschooling families.
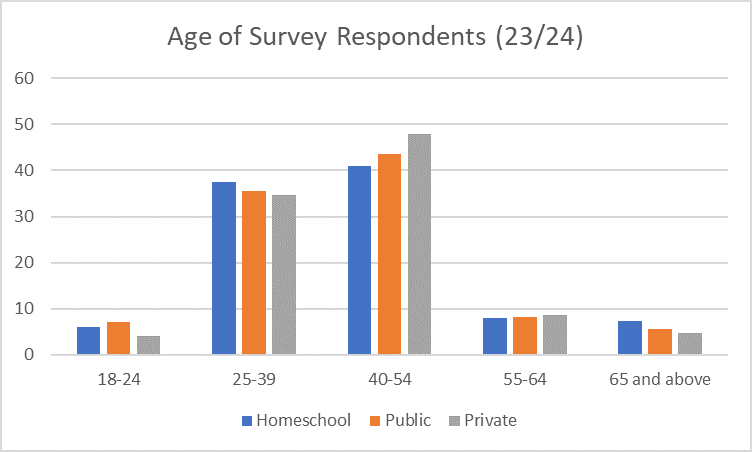
Age
The survey asked participants, “What year were you born?” and participants were asked to fill in their birth year. This data was then organized into five categories: “18-24,” “25-39,” “40-54,” “55-64,” and “65 and above.” Considering only respondents that reported having homeschooled students in their household, 6% of participants were between ages 18-24, 38% were between ages 25-39, 41% were between ages 40-54, 8% were between ages 55-64, and 7% were 65 and above.
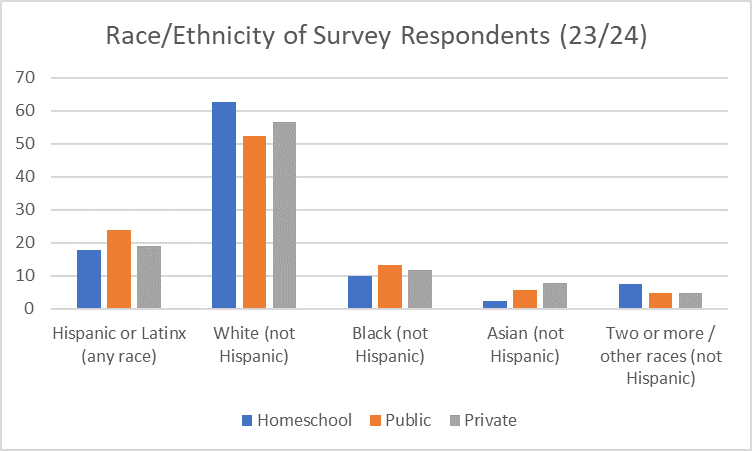
Race and Ethnicity
Participants were asked to report their race and ethnicity on two survey questions. The first question asked, “Are you of Hispanic, Latino, or Spanish origin?” The second question asked, “What is your race? Please select all that apply.” The response options for race included fourteen distinct options, but researchers later organized them into five categories. Considering only respondents that reported having homeschooled students in their household, 18% of participants were Hispanic or Latinx (of any race), 63% were white (not Hispanic), 10% were Black (not Hispanic), 2% were Asian (not Hispanic), and 7% were two or more or other races (not Hispanic).
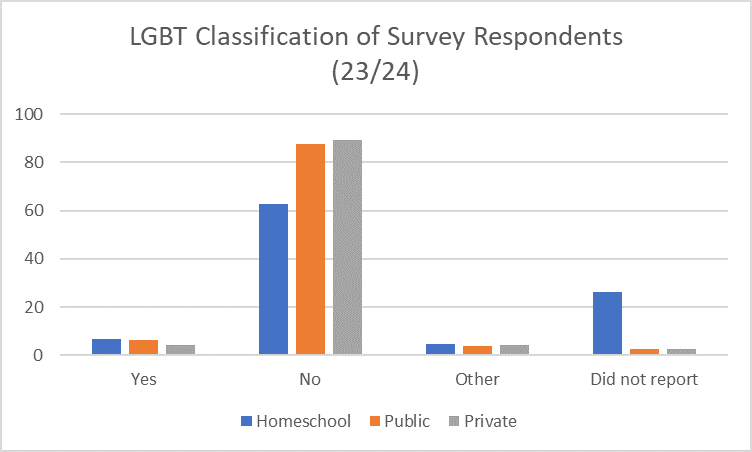
Gender and Sexuality
Several questions on the survey asked participants information about their gender and sexuality. Participants were asked to report their sex assigned at birth, their gender, and their sexuality. Gender was limited to “Male,” “Female,” “Transgender,” and “None of these.” Sexuality was categorized as “Gay or lesbian,” “Straight, that is not gay or lesbian,” “Bisexual,” “Something else,” and “I don’t know.” This data was simplified into a single category labeled “Lesbian, Gay, Bisexual, and Transgender” and the response options were “Yes,” “No,” “Other,” and “Did not report.” Considering only respondents that reported having homeschooled students in their household, 7% of participants reported “Yes,” 63% reported “No,” 5% reported “Other,” and 25% did not report.
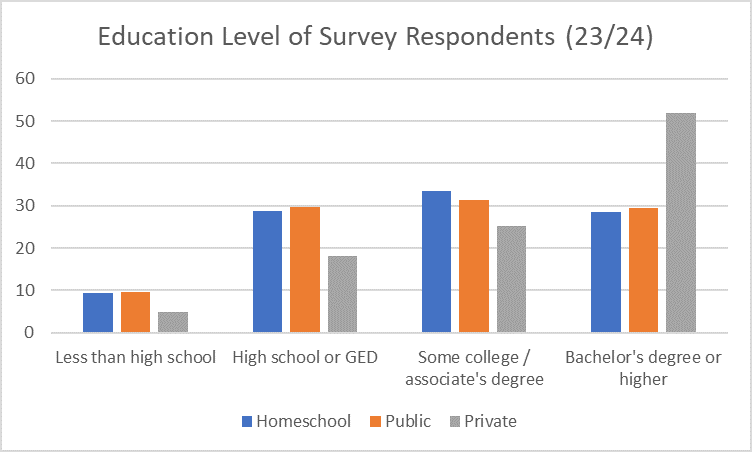
Education Level
In regard to education, participants were asked, “What is the highest degree or level of school you have completed?” Participants could select one of seven options, but the researchers later combined this data into just four categories: “less than high school,” “high school or GED,” “some college / associate’s degree,” and “bachelor’s degree or higher.” Considering only respondents that reported having homeschooled students in their household, 9% of participants had less than high school, 29% had a high school diploma or GED, 33% had some college or an associate’s degree, and 29% had a bachelor’s degree or higher.
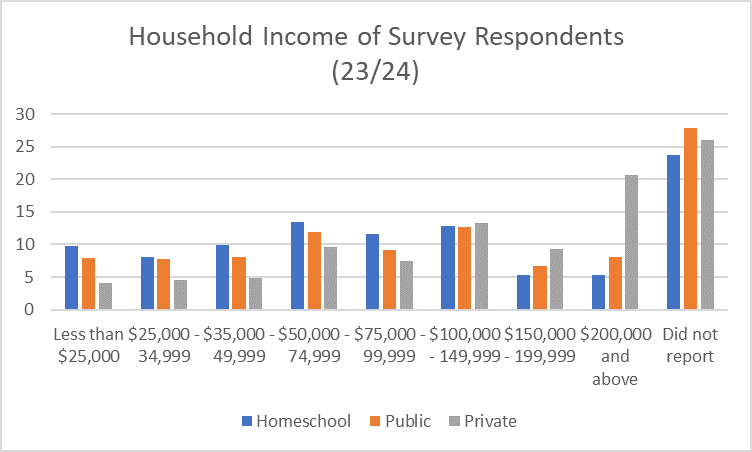
Household Income
The survey asked participants, “In 2023 what was your total household income before taxes? Select only one answer.” The survey offered eight distinct salary ranges, starting at “less than $25,000” and ending with “200,000 and above.” Researchers added an additional category for participants that did not respond to the question. Considering only respondents that reported having homeschooled students in their household, 10% made less than $25,000, 8% made between $25,000-34,999, 10% made between $35,000-49,999, 13% made between $50,000-74,999, 12% made between 75,000-99,999, 13% made between 100,000-149,999, 5% made between 150,000-199,999, 5% made 200,000 and above, and 24% did not report.

Want to learn more about the Johns Hopkins Homeschool Research Lab?